
In a previous post, I wrote about using Splunk to monitor network health and connectivity. While building that project, I thought it would be nice if I could build a more generic application which could be used to perform ad hoc data analysis on pre-existing data without having to go through a complicated process each time I wanted to do some analytics.
So I built Splunk Lab! It is a Dockerized version of Splunk which, when started, will automatically ingest entire directories of logs. Furthermore, if started with the proper configuration, any dashboards or field extractions which are created will persist after the container is terminated, which means they can be used again in the future.
A typical use case for me has been to run this on my webserver to go through my logs on a particularly busy day and see what hosts or pages are generating the most traffic. I’ve also used this when a spambot starts hitting my website for invalid URLs.
So let’s just jump right in with an example:
SPLUNK_START_ARGS=--accept-license \
   bash <(curl -s https://raw.githubusercontent.com/dmuth/splunk-lab/master/go.sh)
This will print a confirmation screen where you can back out to modify options. By default, logs are read from logs/, config files and dashboards are stored in app/, and data that Splunk ingests is written to data/.
Once the container is running, you will be able to access it at https://localhost:8000/ with the username “admin” and the password that you specified at startup.
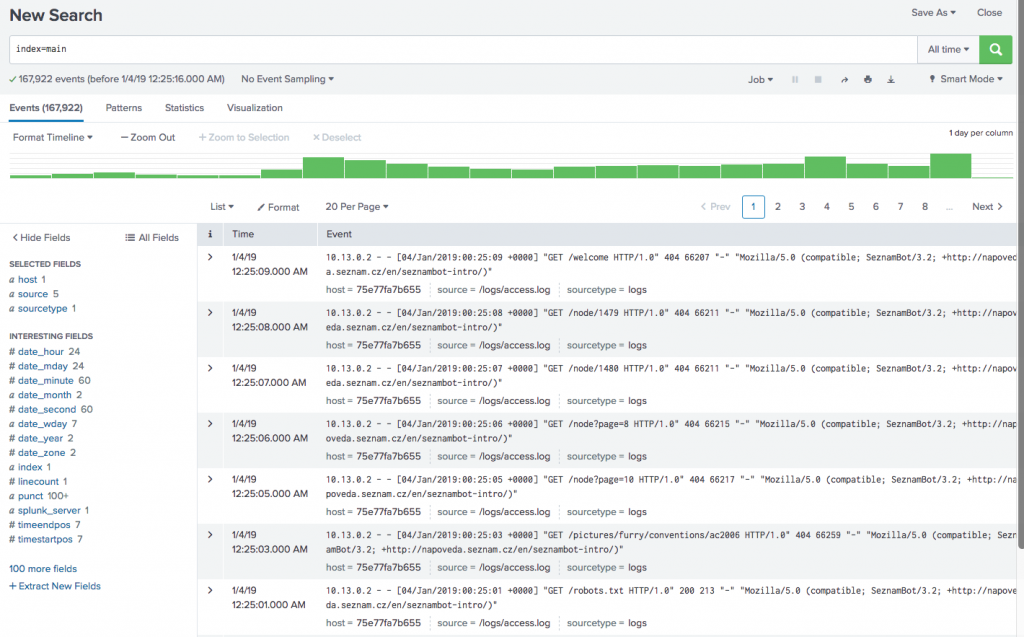
First things first, let’s verify our data was loaded and do some field extractions!


Main Index 

Field Extractions
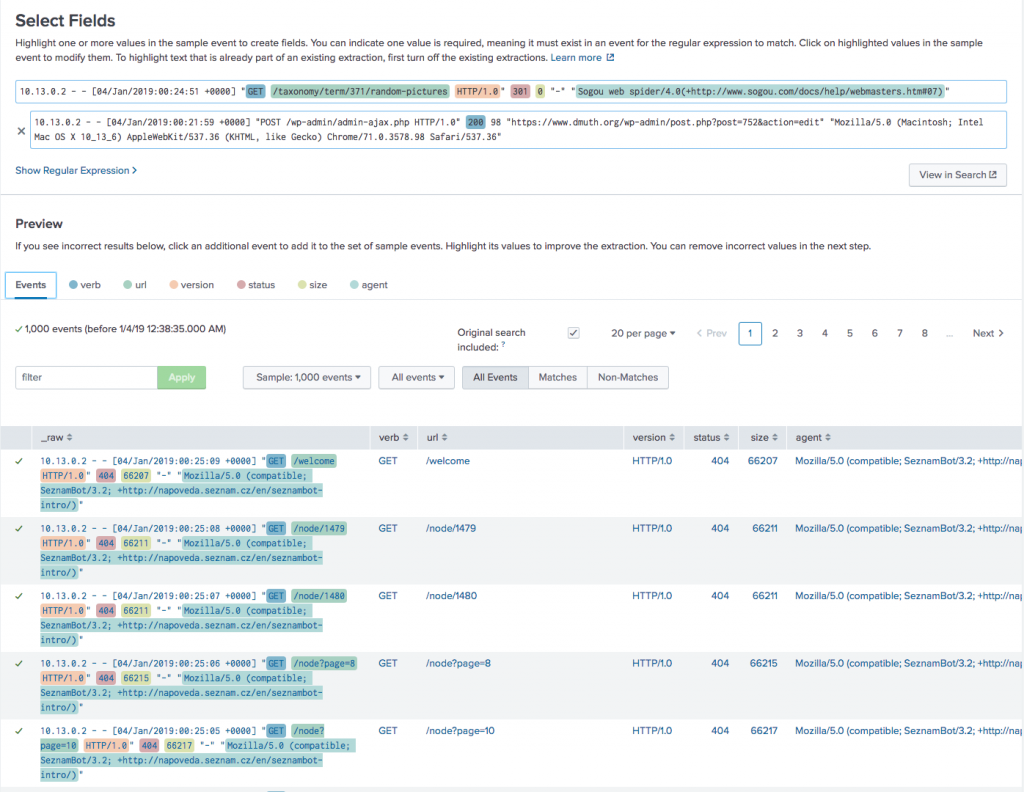
Note that the IP addresses are all in Net 10 because that’s apparently a Docker thing. I haven’t yet figured out how to properly pass along the proper IP addresses yet.
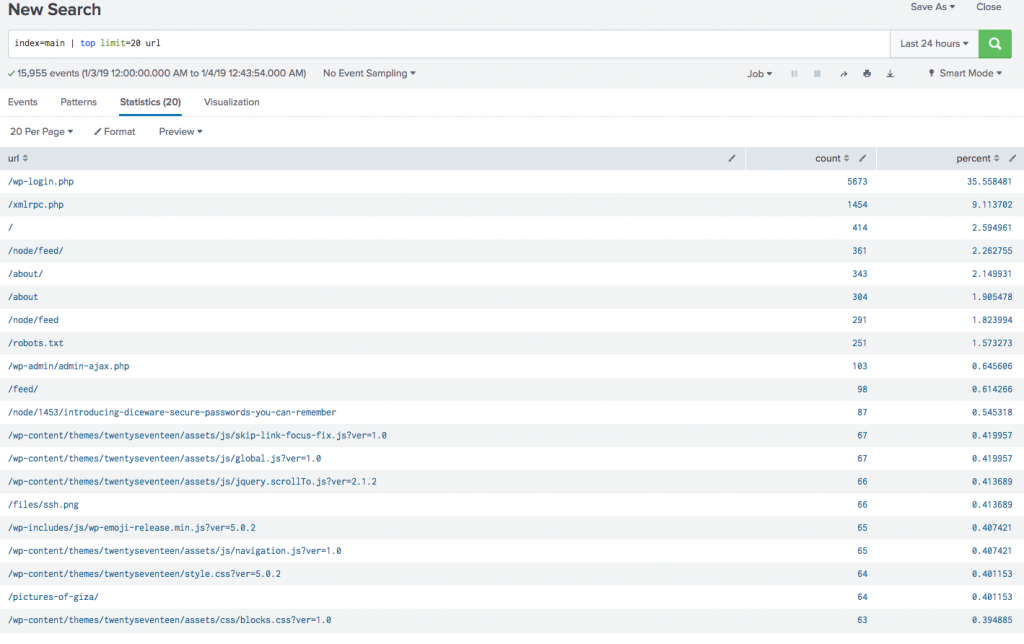
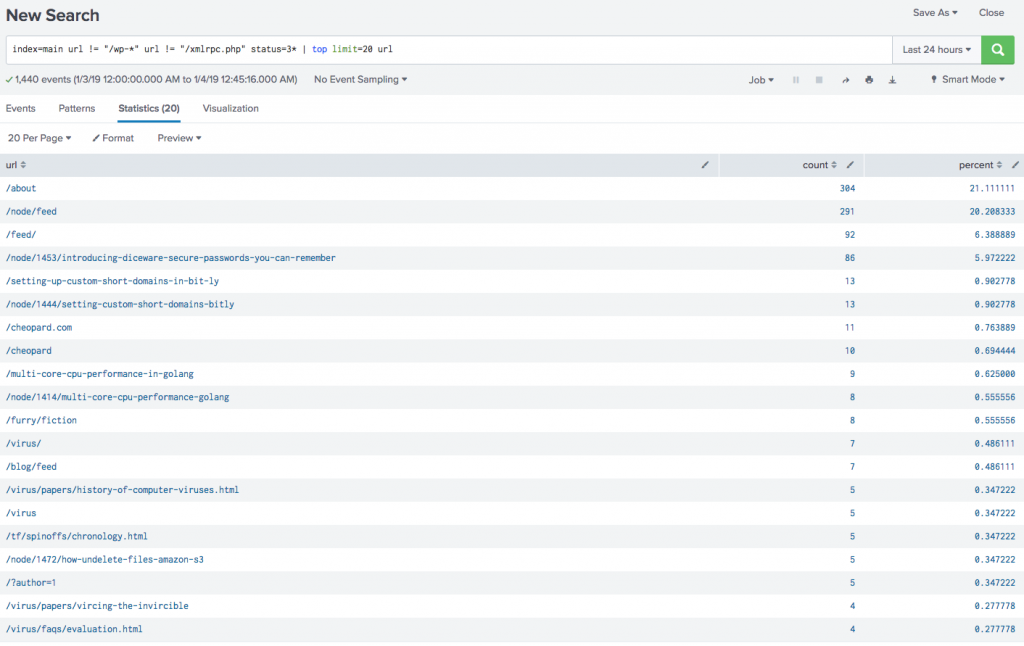
Next, let’s get our list of top URLs which were requested, the top URLs which resulted in HTTP 200 statuses, the top 3xx redirections, and finally the top agents which resulted in HTTP 404 (not found) errors:


Top URLs 

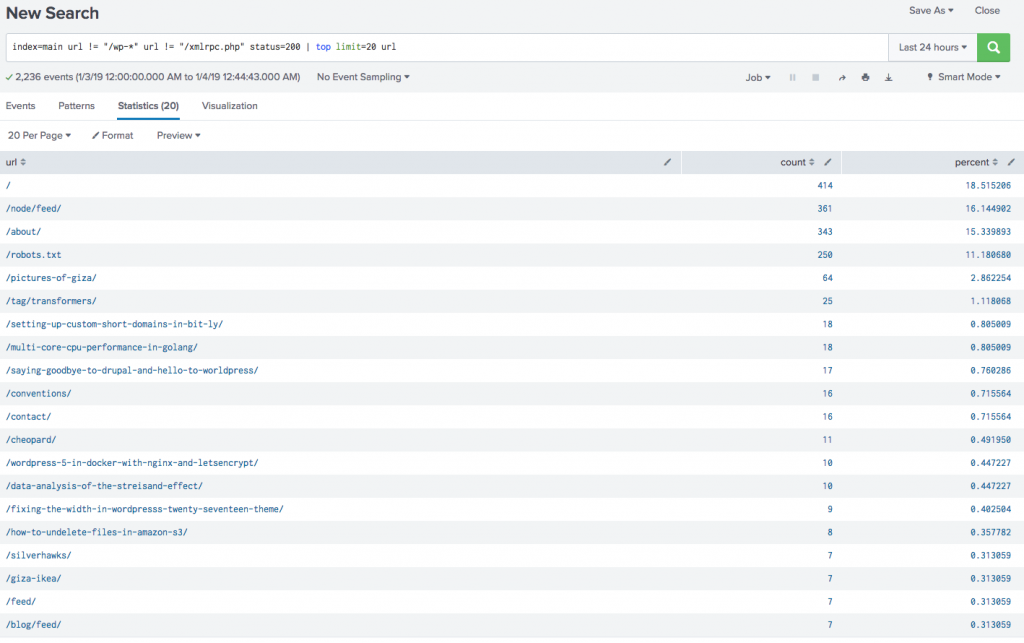
Top HTTP 200 URLs 

Top HTTP 3xx Redirections 

Top 404 Agents
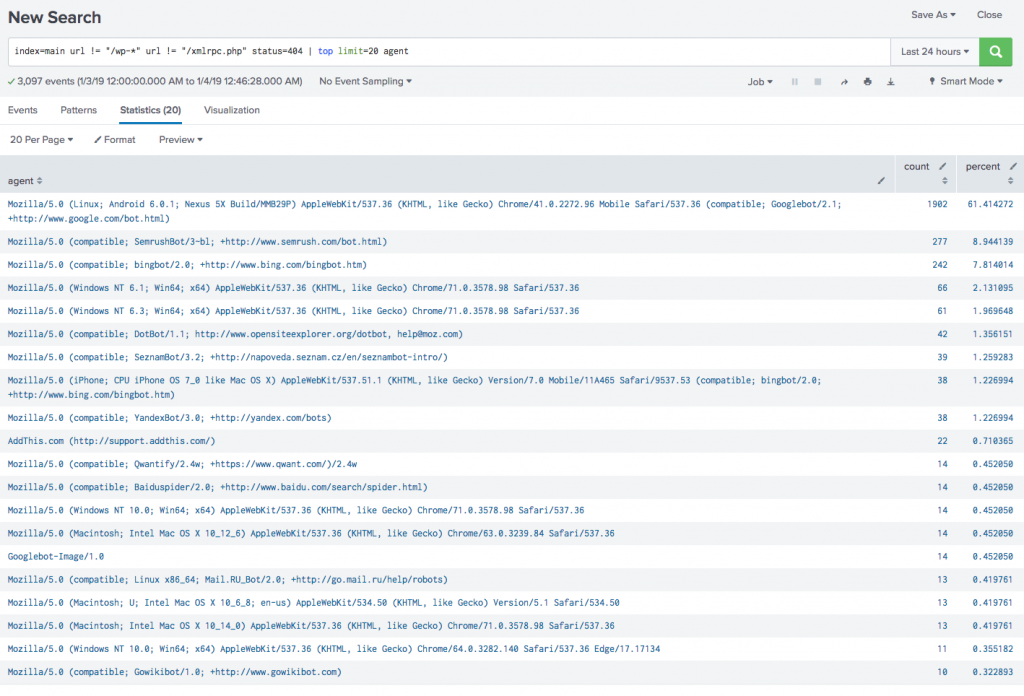
Sure were a lot of 404s in there. Probably because I moved from Drupal last month.
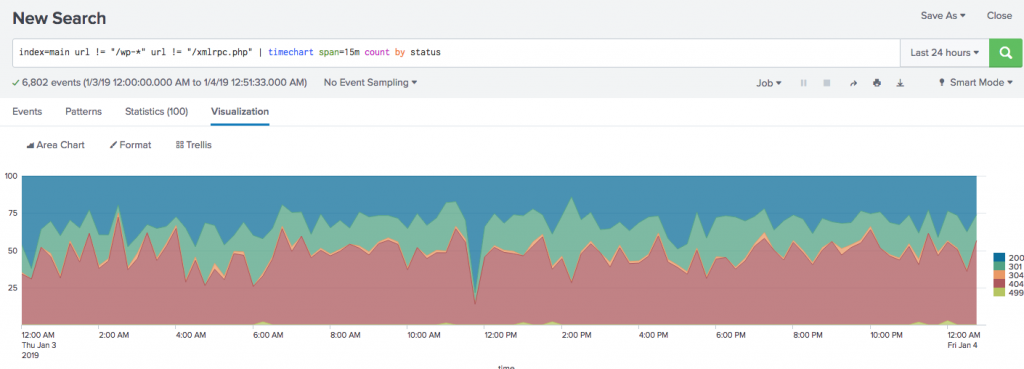
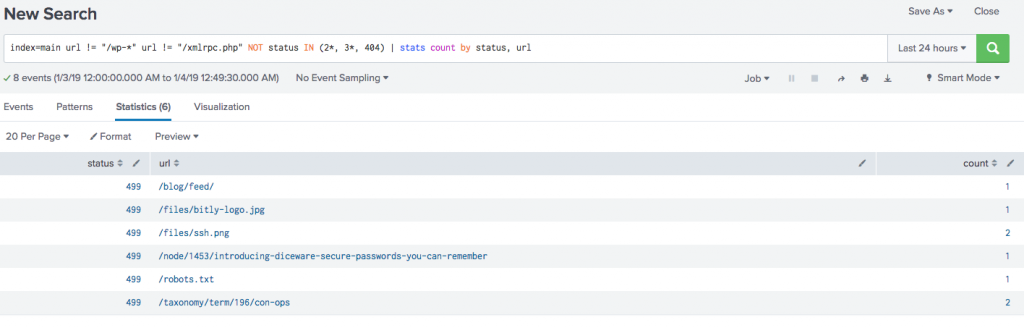
Finally, let’s generate a graph of HTTP statuses and then list the URLs which had statuses that weren’t 2xx, 3xx, or 404:


Graph of HTTP Statuses 

URLs with Errors
And that’s about all there is to it! In less than 5 minutes, I was able to use Splunk to get insight into real production data, and learn things such as URLs which were returning errors, and even found a couple of issues with my webserver.
I’ve said it before and I’ll say it again, Splunk is fantastic for analyzing data, and the ability to do runtime field extractions is a big big plus that it offers over other products such as Elasticsearch/ELK. Definitely check into Splunk, you won’t be sorry.
If you want to play around with the source of this app, I have it up on GitHub at https://github.com/dmuth/splunk-lab
Got questions or comments? Let me know below!
— Doug