I Created an AI Chatbot of Gritty, and it is Horrifying

Living 20 minutes from downtown Philadelphia, I’m a big fan of our hockey mascot, Gritty. Recently I’ve been playing around with a website called character.ai, and one of the neat things that site lets you do is create bots based on characters, real or imaginary. For example, there is one character based on Albert Einstein, and another is based on Darth Vader. So I decided I would create a character based on Gritty.

I immediately regretted that.

The AI powering that site is… frightfully good, to say the least. After seeding the character with just a handful of tweets from Gritty’s Twitter feed, the bot quickly took on a life of its own and said things that I would absolutely expect the real Gritty to say.

For example, let’s start with the no-fly list:

Well then.

Next I asked Gritty about his diet, and the answers the bot gave were concerning, to say the least:

Continue reading “I Created an AI Chatbot of Gritty, and it is Horrifying”

Philadelphia Public Transit vs COVID-19

We’re well past a month into the COVID-19 shutdown, and I noticed that fewer and fewer trains were running on Regional Rail each day. I knew that SEPTA had decreased their service due to less riders, but I wondered just how strict the service cuts were. I also wondered if more or perhaps less trains were running on time.

Fortunately, I have several years worth of train data due to running SeptaStats.com, so I could answer these questions myself!

I started off by firing up Splunk Lab then went for a walk while it took 15 minutes or so to load the data up. I came back, and decided to see where we were:

“That’s one big Twinkie.”

That’s well north of 60 million data points. While I could crunch that data as-is, it would take longer for me to run my subsequent queries as well as look for trends in the data. I ended up writing a couple of scripts to summarize that data on a daily basis, so that I can get a bucketed breakdown of late trains for the entire day. We’ll get back to that bucketing later, because I first want to talk about train volumes.

I figured that with the perceived dropoff in service, I could look at how many distinct trains (identified by train number) each day. Sure enough, there was a drop off in train service levels:

“Symmetrical book stacking… just like the Philadelphia mass turbulence of 1947!”

Things started to get serious the week of Monday, March 16th. In fact, that was the last day of “normal” service on Regional Rail. Starting on Tuesday the 17th, the number of trains per weekday went from nearly 500 to about 362, with the weekends unaffected.

Continue reading “Philadelphia Public Transit vs COVID-19”

Examining 12 Months of SEPTA API Queries

With the release of SEPTA’s new app, I’ve suddenly been flooded with questions about their API. People wanted to know how stable it was.

Well, I don’t work for SEPTA, which means I don’t have insight into their operations, but I can perform some analytics based on what I have, which is approximately 18 months of Regional Rail train data, read every minute by SEPTA Stats.

Overall Stats

This is all of the data that I have in Septa Stats currently:

  • Events Since Inception: 26,924,887 events
  • First Event: Mar 1, 2016 12:00:01 AM
  • Last Event: Nov 16, 2017 10:33:53 PM

That’s way more events than minutes in that timeframe, and the reason for that is each API query is split into a separate event for each train. So if an API call returns status for 20 trains, that gets split into 20 different events. This is done because Splunk has a much easier time working with JSON that isn’t a giant array. 🙂

Continue reading “Examining 12 Months of SEPTA API Queries”

Introducing the SEPTA Regional Rail System Dashboard!

…and 2 new API endpionts, too. But more on those later.

I’m proud to say that there is now a dashboard for the entire Regional Rail system. It is present on both the front page and the “SEPTA System Stats” page:

This new dashboard makes it straightforward to determine the status of the entire Regional Rail system at a glance.

Continue reading “Introducing the SEPTA Regional Rail System Dashboard!”

Running Dorsai Thing 2013: Lessons Learned

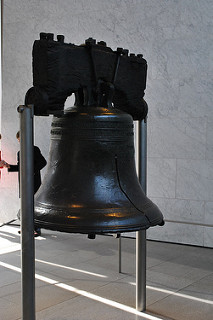
The Liberty Bell

Each year, The Dorsai Irregulars have their own annual convention known as “Dorsai Thing”. It is a weekend long event, held in a different city each year, where we all gather, socialize, and hold our semi-annual business meeting. This year, it was held in Phildelphia, and it fell on my shoulders to run the event, dubbed “Liberty Thing” While I’ve worked at plenty of conventions before, this was the first one where I was effectively the Con Chair. This was an entirely new thing for me, and I wanted to write a blog post about some of the things I learned during the experience.

Continue reading “Running Dorsai Thing 2013: Lessons Learned”