Using Splunk on Hotel Internet

Splunk> Finding your faults, just like Mom.

In a previous post, I wrote about using Splunk to monitor network health. While useful for home and office use, there’s another valuable use for this app, and that’s when traveling.

In my case, over my Christmas vacation, I checked into a Mom and Pop hotel, or rather a motel! It was about 24 rooms all in a row, occupying a single floor. Since they were on a budget, their Internet offering consisted of what appeared to be 5 or 6 Linksys routers set up every few rooms. You’d simply connect to the closest access point and have Internet.

But there was a problem: determining which access point was closest to me! The signal strength indicator on my computer showed several of them were 3/3 bars so that wasn’t much help. I tried connecting to the first one, but had virtually no Internet connectivity.

That’s when I fired up Splunk:

SPLUNK_START_ARGS=--accept-license \
TARGETS=google.com,1.1.1.1,8.8.8.8,192.168.1.1 \
   bash <(curl -s https://raw.githubusercontent.com/dmuth/splunk-network-health-check/master/go.sh)

Running that command will print up a confirmation screen so that you can back out and change any options (such as hosts to ping), and when you’re ready, just hit <ENTER> to start the container.

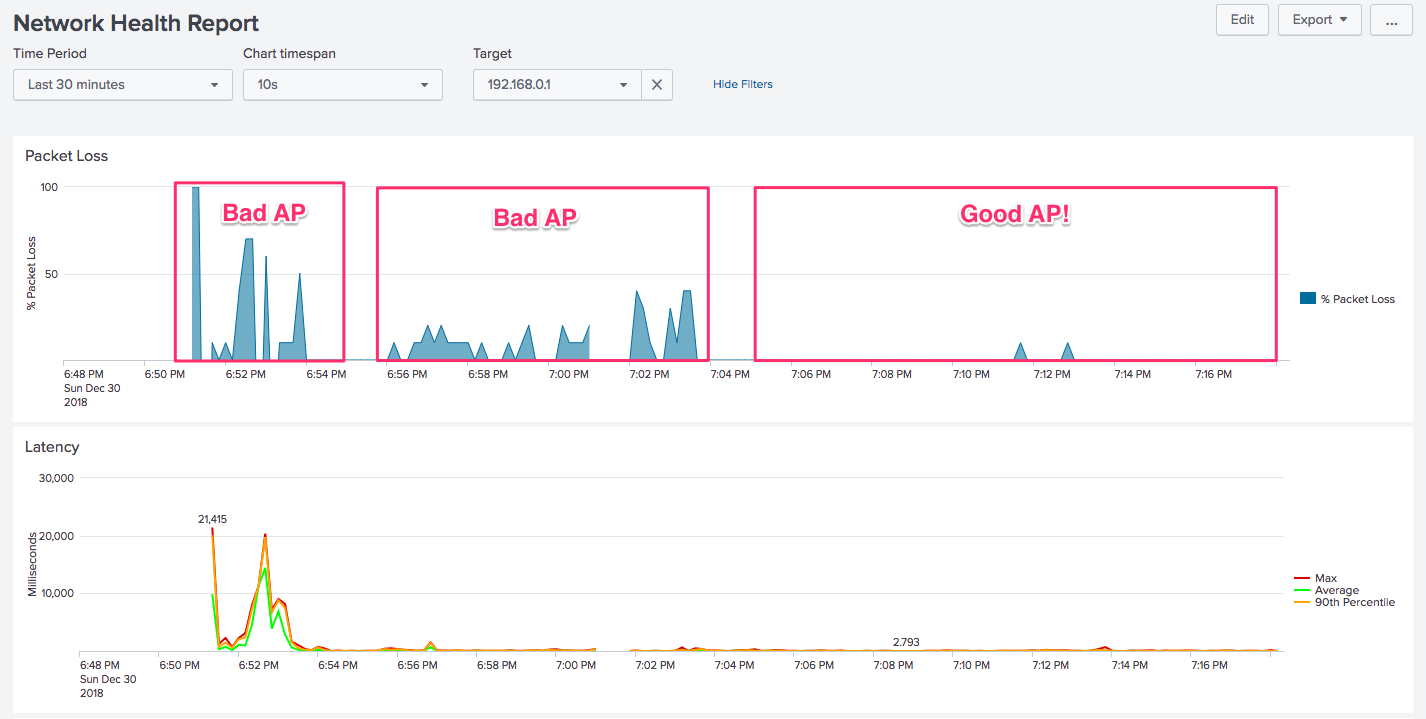
In the above example, I added in the TARGETS environment variable, and was sure to include 192.168.1.1, which was the IP for each router (they were all the same). Then I set Splunk “real-time mode” and periodically checked that tab as I was working. This is what I saw:

Testing 3 separate hotel Access Points with Splunk
Continue reading “Using Splunk on Hotel Internet”

Using Splunk to Monitor Network Health

Splunk> Winning the War on Error

I’ve been using Splunk professionally over the last several years, and I’ve become a big fan of using it for my data processing needs. Splunk is very very good about ingesting just about any kind of event data, optionally extracting fields at search time, and providing tools to graph that data, find trends, and see what is really happening on your platform. This is important when your platform consists of thousands of servers, as it does at my day job!

While Splunk can handle events in timestamp key=value key2=value2 format, it also has support for dozens of standardized formats such as syslog, Apache logs, etc. If your data is in a customized format, no problem! Splunk can extract that data at either index or search time! Finally, there’s the Search Processing Language, which is like SQL but for your event data. With SPL, you can run queries, generate graphs, and combine them all programatically.

So yeah, I’m a huge fan of Splunk. One thing I use it for out of the of office is to graph the health of my Internet connection. This is useful both for when I’m at home and when I am traveling–I just feed the output of ping into Splunk and then I can get graphs of packet loss and network latency.

Let’s just jump into an example screen–here’s what I saw when I was a friend’s place and I uploaded a video to YouTube:

Continue reading “Using Splunk to Monitor Network Health”