If you’re been reading this blog for awhile, you’ll know that I’m a big fan of Splunk, and I even went so far as to Dockerize it for use in a lab/testing environment.
CSI: Logfiles
Well today I want to talk about a command in Splunk which I believe is seriously underrated: makeresults.
Makeresults (documented here) lets you generate fake events for testing purposes. No indexes are queried, no disks are touched, which means that makes results is very very fast. And when a query runs quickly, that means you can run it more times which means new queries and content will be developed faster.
In this post, I’m going to walk you through a way to use makeresults to learn the difference between the streamstats and eventstats commands.
Tarsplit is a utility I wrote which can split UNIX tarfiles into multiple parts while keeping files in the tarballs intact. I specifically wrote those because other ways I found of splitting up tarballs didn’t keep the individual files intact, which would not play nice with Docker.
But what does Docker have to do with tar?
“Good tea. Nice house.”
While building the Docker images for my Splunk Lab project, I noticed that one of the layers was something like a Gigabyte in size! While Docker can handle large layers, the issue become one of time it takes to push or pull an image. Docker does validation on each layer as it’s received, and the validation of a 1 GB layer took 20-30 wall clock seconds. Not fun.
It occurred to me that if I could split up that layer into say, 10 layers of 100 Megabytes each, then Docker would transfer about 3 layers in parallel, and while a layer is being validated post-transfer, the next layer would start being transferred. The end result is less wall clock seconds to transfer an entire Docker image.
But there was an issue–Splunk and its applications are big. A few of the tarballs are hundreds of Megabytes in size, and I needed a way to split those tarballs into smaller tarballs without corrupting the files in them. This led to Tarsplit being written.
Because a Docker container is quicker than spinning up a VM.
According to the docs, Eventgen is a Splunk App that lets users built real-time event “generators” so that one-off event generators don’t need to be built.
What does this mean? Let’s say you run a Splunk platform, and you want to create some new dashboards for a data source in production, but want to do this on dev. Without Eventgen, you would need to write a script to generate fake events and write them to a file which is read in by Splunk. That is a lot of work.
And we all have better things to do than write one-off code.
Why Use Eventgen?
With Eventgen, you can create a sample file with say, 1,000 events from that data source, and configure Eventgen to write a random event from that file straight to Splunk via its API, with current timestamps. The end result is that you’ll have a steady stream of realistic events flowing into Splunk with current timestamps, without the need to read from (and rotate) logfiles in the filesystem.
How Eventgen Is Used in Splunk Lab
I took approximately 1,400 lines of logs from my blog’s webserver and included them into Splunk Lab. When Eventgen is used, a random event from that file will be written into Splunk at the rate of approximately once per second. Because the events that make their way into Splunk are random, there will be a short-term fluctuation in the frequency of specific URLs, HTTP verbs, HTTP statuses, etc. This is perfect for creating dashboards that mimic what you might see in a production environment.
If you are storing files in Amazon S3, you absolutely positively should enable AWS S3 Access Logging. This will cause every single access in a bucket to be written to a logfile in another S3 bucket, and is super useful for tracking down bucket usage, especially if you have any publicly hosted content in your buckets.
But there’s a problem–AWS goes absolutely bonkers when it comes to writing logs in S3. Multiple files will be written per minute,each with as few as one event in them. It comes out looking like this:
Serverless is an app which lets you deploy applications on AWS and other cloud providers without actually spinning up virtual servers. In our case, we’ll use Serverless to create a Lambda function which executes periodically and performs rollup of logfiles.
So once you have the code, here’s how to deploy it:
cp serverless.yml.exmaple serverless.xml
vim serverless.xml # Vim is Best Editor
serverless deploy # Deploy the app. This will take some time.
I’ve also written (or, in one case, re-written) apps using Splunk Lab as a jumping off point. Here’s what I have so far:
Splunk Yelp Reviews – Lets you pull down Yelp reviews for venues and view visualizations and wordclouds of positive/negative reviews in a Splunk dashboard
Splunk Telegram – This app lets you run Splunk against messages from Telegram groups and generate graphs and word clouds based on the activity in them.
Splunk Network Health Check – Pings 1 or more hosts and graphs the results in Splunk so you can monitor network connectivity over time.
…plus a few other things that I’m not quite ready to release yet. 🙂
Awhile ago, I found myself trying to make a decision on which of several restaurants to eat at. They were all highly rated in Yelp, but surely there might be more insights I could pull from their reviews. So I decided to Splunk them!
Yelp has an API but, I am sorry to say that it is awful. It will only let you download 3 reviews for any venue. That’s it! What a crime.
So… I had to crawl Yelp venue pages to get reviews. I am not proud of this, but I was left with no other other option.
Python has been my go-to language lately, so I decided to solve the problem of review acquisition with Python. I used the Requests module to fetch the HTML code, and the Beautiful Soup module to extract reviews and page links from the HTML.
I recently noticed that something was using up lots of RAM on my Mac, as it would periodically slow down. I had some suspects, but rather than regularly checking in Activity Monitor, I thought it would be more helpful if I had a way to monitor usage of RAM by various processes over time.
Due to previous success with my Splunk Lab app, I decided to use it as the basis for building out a RAM monitoring app. The data acquisition part, however, was trickier. The output of the UNIX ps app isn’t very structured, and I had some problems parsing that data, especially in situations where there were spaces in filenames and arguments to those commands.
So I wrote a replacement for PS. It turns out that Python has a module called psutil, which lets you programmatically examine the process tree on your Mac. I ended up writing an app called Better PS, and it writes highly structured data on each current process to disk, which is then ingested by Splunk.
One of my activities outside of the office consists of staffing furry conventions. One of those conventions is Anthrocon, a furry convention held in downtown Pittsburgh every June/July. At that particular convention, I manage the website and their social media properties.
Yesterday, we opened general hotel reservations, and that resulted in a huge rush of members booking hotel rooms. 1,000 rooms were booked in the first 15 minutes! This was completely expected, and we kept track of how things played out on social media, and also took a survey of members who booked hotel rooms to see how things went. In this post, we’re going to share what we learned based on those survey results and Twitter activity.
HOTEL BOOKINGS
First, did people who booked a hotel room get the hotel that they wanted?
Did you get the hotel you wanted?
For nearly 70% of you, the answer is yes. This makes us happy, but we would like to see the number higher—ideally 100% of our attendees would get a room in the hotel of their choice. This is something we continue to work on each year by adding new hotels and getting bigger room blocks in existing hotels.
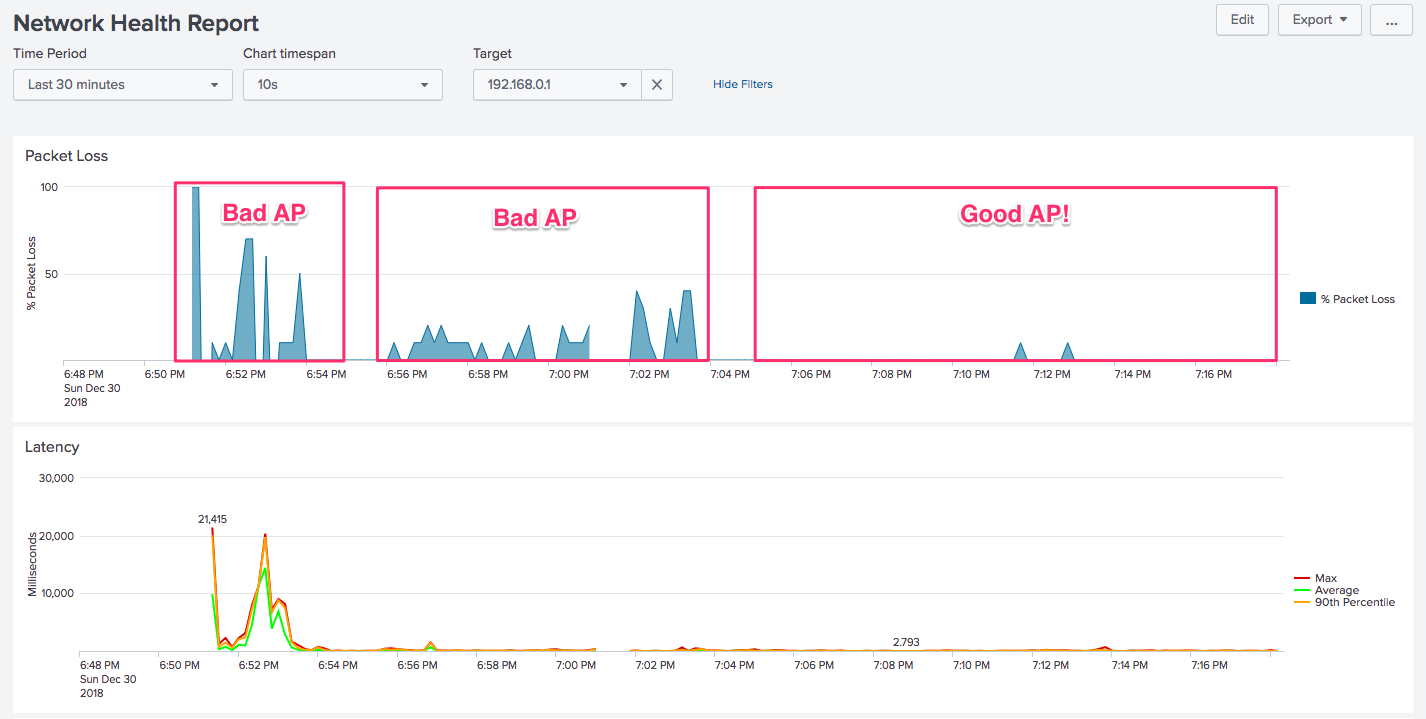
In a previous post, I wrote about using Splunk to monitor network health. While useful for home and office use, there’s another valuable use for this app, and that’s when traveling.
In my case, over my Christmas vacation, I checked into a Mom and Pop hotel, or rather a motel! It was about 24 rooms all in a row, occupying a single floor. Since they were on a budget, their Internet offering consisted of what appeared to be 5 or 6 Linksys routers set up every few rooms. You’d simply connect to the closest access point and have Internet.
But there was a problem: determining which access point was closest to me! The signal strength indicator on my computer showed several of them were 3/3 bars so that wasn’t much help. I tried connecting to the first one, but had virtually no Internet connectivity.
Running that command will print up a confirmation screen so that you can back out and change any options (such as hosts to ping), and when you’re ready, just hit <ENTER> to start the container.
In the above example, I added in the TARGETS environment variable, and was sure to include 192.168.1.1, which was the IP for each router (they were all the same). Then I set Splunk “real-time mode” and periodically checked that tab as I was working. This is what I saw:
In a previous post, I wrote about using Splunk to monitor network health and connectivity. While building that project, I thought it would be nice if I could build a more generic application which could be used to perform ad hoc data analysis on pre-existing data without having to go through a complicated process each time I wanted to do some analytics.
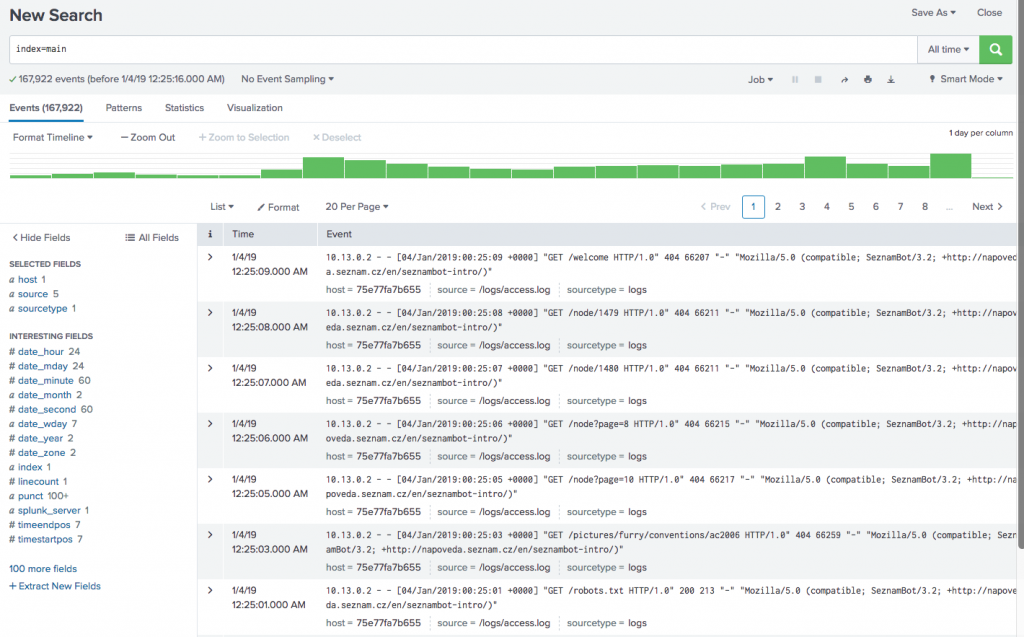
So I built Splunk Lab! It is a Dockerized version of Splunk which, when started, will automatically ingest entire directories of logs. Furthermore, if started with the proper configuration, any dashboards or field extractions which are created will persist after the container is terminated, which means they can be used again in the future.
A typical use case for me has been to run this on my webserver to go through my logs on a particularly busy day and see what hosts or pages are generating the most traffic. I’ve also used this when a spambot starts hitting my website for invalid URLs.
This will print a confirmation screen where you can back out to modify options. By default, logs are read from logs/, config files and dashboards are stored in app/, and data that Splunk ingests is written to data/.
Once the container is running, you will be able to access it at https://localhost:8000/ with the username “admin” and the password that you specified at startup.
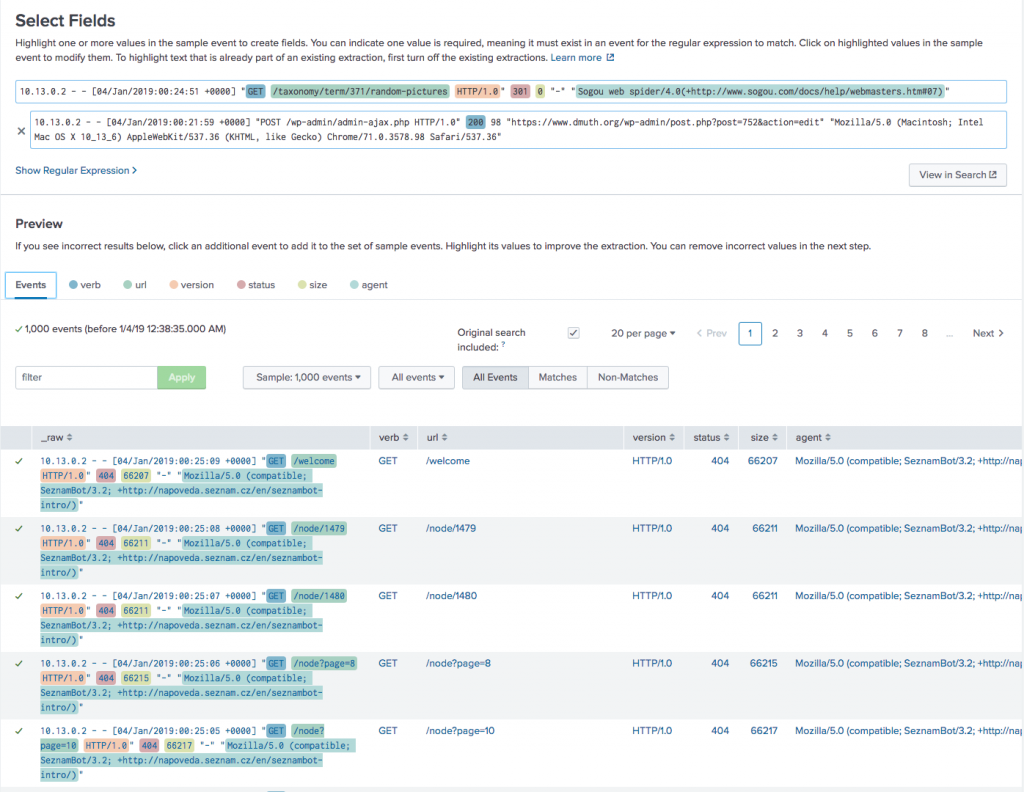
First things first, let’s verify our data was loaded and do some field extractions!