
With the release of SEPTA’s new app, I’ve suddenly been flooded with questions about their API. People wanted to know how stable it was.
Well, I don’t work for SEPTA, which means I don’t have insight into their operations, but I can perform some analytics based on what I have, which is approximately 18 months of Regional Rail train data, read every minute by SEPTA Stats.
Overall Stats
This is all of the data that I have in Septa Stats currently:
- Events Since Inception: 26,924,887 events
- First Event: Mar 1, 2016 12:00:01 AM
- Last Event: Nov 16, 2017 10:33:53 PM
That’s way more events than minutes in that timeframe, and the reason for that is each API query is split into a separate event for each train. So if an API call returns status for 20 trains, that gets split into 20 different events. This is done because Splunk has a much easier time working with JSON that isn’t a giant array. 🙂
Types Of Errors
So far, I’ve seen several distinct types of errors:
- Database errors: I would get a JSON data structure back with an error field that literally says “Error connecting to database server” in it.
- Timeouts: CURL on my end times out after 3000 milliseconds
- Trainview is disabled.I would get a JSON data structure back an error field that says “We apologize for the inconvenience, but we are experiencing difficulties at this time. TrainView has been disabled.”
- Bad data: I would get back data that could not be parsed as JSON. My script was supposed to print the data it got, but due to a bug (now fixed), it did not. (Oops)
I decided to check the time period for a subset of what I have above — November 1st, 2016 through October 31st, 2017. Exactly 12 months.
First, let’s look at total errors:
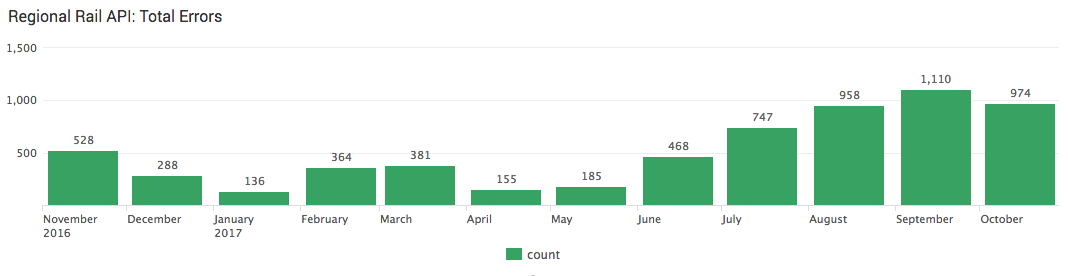
Ouch, that’s quite a bit! Let’s break those errors down by error type:
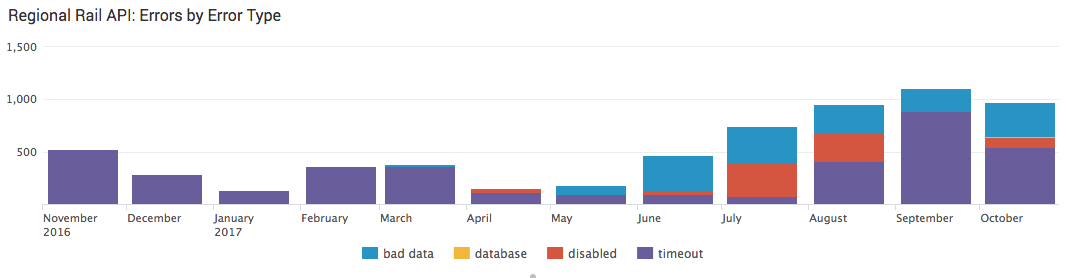
Database errors are relatively rare (you can see a slight sliver of yellow in October if you squint really hard), but the biggest one over the last 12 months seems to be timeouts. The machine that hosts Septa Stats is located in Digital Ocean’s NYC datacenter, and my own monitoring with NodePing hasn’t reported any major issues with the site, so all signs point to the timeout being something on SEPTA’s side of things.
Of equal concern is the bad data I’ve been getting back, which has been increasing over the last 6 months. With the bugfix I pushed out earlier today, I’ll have a chance to see what I’m getting back, and may be able to comment further on that in the future.
Determining API Availability
I also wanted to determine how available the API is — that is, how often did it return a response which is now an error? Since the train data updated once a minute, I would query the API once every 50 seconds. I chose 50 seconds because if I had queried the API exactly every 60 seconds, delays in the response would occasionally mean missing a specific minute’s worth of data. My Splunk queries were built to be idempotent, so having a duplicate reading (such as a reading at 12:01:05 AM and 12:01:55 AM) would not present any issues.
This left me with a slight issue, though. What happens if I get two errors in the same minute? In an attempt to try and simplify things, I decided that if I get an error at any point in a minute, I would treat that as “unavailable”. For you Splunk nerds, this is the query text I used:
| eval date_str=date_year + date_month + date_mday + +”-” + date_hour + date_minute
| eval time=strftime(_time, “%Y%m%d-%H%M”)
| dedup time
Generally, 99.9% percent availability, or “3 nines” is what we want to aim for. That means that only 1 request out of every 1,000 will fail. For things that are less critical, 99.5% (5 requests fail out of every 1,000) could also be acceptable. Anything lower than that is… not desirable.
So let’s look at uptime percentage by month:
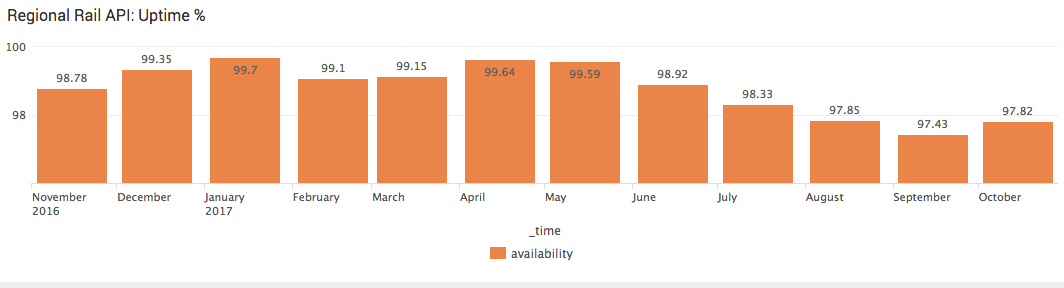
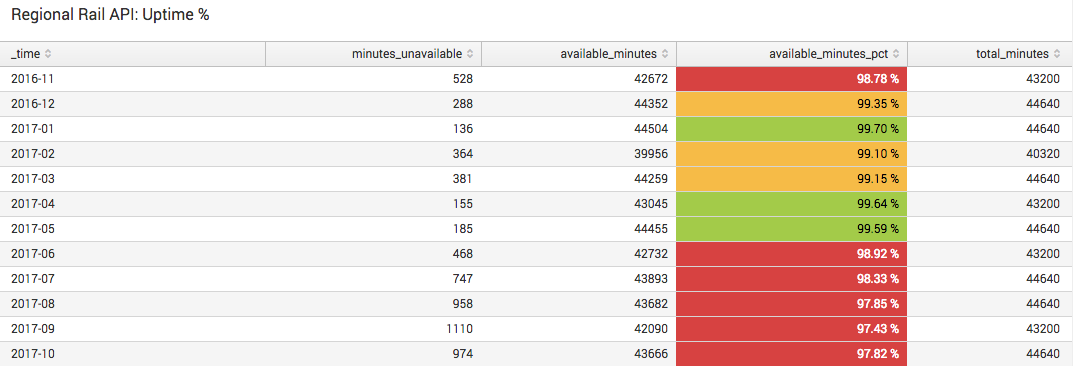
..ouch. Over the last 12 months, exactly zero of those months have had uptime of 99.9% or greater. Only 3 months exceeded 99.5% uptime, and another 3 months exceeded 99%. The remaining 6 months had uptimes of less than 99%, and two of those months had uptimes of less than 98%.

It’s not good at all. Imagine if a bank’s API had uptime of 98%, meaning that 20 out of every 1,000 customers who attempted to use it got an error. How long do you suppose that bank would be in business?
In SEPTA’s case, this is a service that is used by websites and apps, presumably including SEPTA’s own apps.
There is clearly room for improvement here.
Recommendations for SEPTA
While it’s great that SEPTA is releasing new apps, they need to focus on their infrastructure to ensure that their apps actually have something to talk to.
Moving forward, I think SEPTA could benefit from the following:
- If existing technology infrastructure is not being monitored, that needs to change immediately. I’d like to point out that Splunk comes with a free 500 MB/day license. 🙂
- If RCAs (Root Cause Analysis) are not performed after outages, this is also highly recommended, both as a learning experience for all parties involved and to keep the same types of outages from happening over and over.
- I have heard the extremely unflattering phrase “computer museum” uttered to describe SEPTA’s datacenter. I don’t know how much (if any) truth there is to that, but if SEPTA is running on old hardware and software, it might be time for some upgrades. AWS is pretty solid these days, I’m just sayin’. 🙂
That’s about all I got for now. Free to leave comments below. My full dataset is also available if anyone would like a copy. Just let me know!
— Doug