
…and 2 new API endpionts, too. But more on those later.
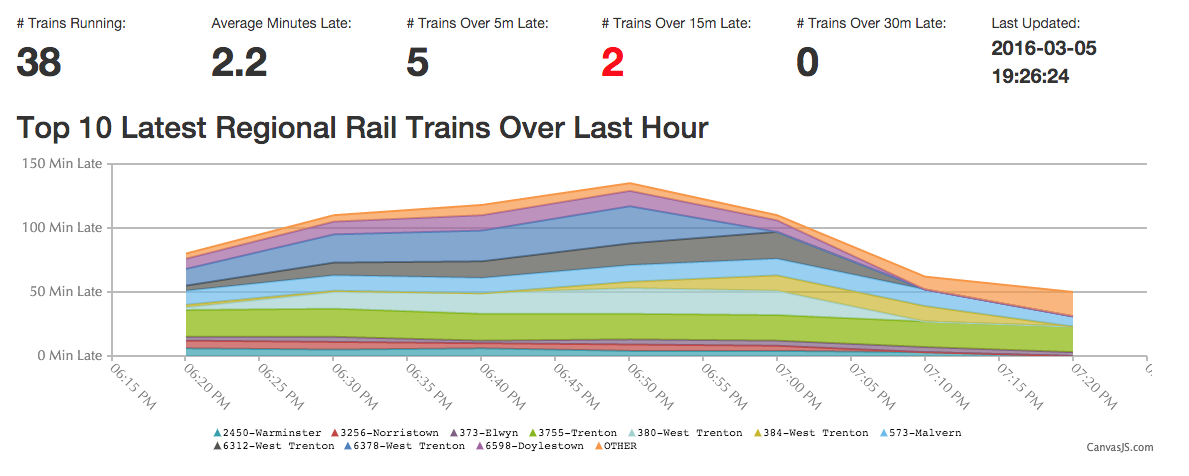
I’m proud to say that there is now a dashboard for the entire Regional Rail system. It is present on both the front page and the “SEPTA System Stats” page:

This new dashboard makes it straightforward to determine the status of the entire Regional Rail system at a glance.
I also introduced two new API endpoints to make this dashbaord possible. The first returns all currently running trains:
/api/current/system/latest/As with the previous “latest” API, each train’s data will look not unlike this:
{
 “id”: “274-Norristown”,
 “time”: “2016–04–04T23:34:13”,
 “late”: “12”,
 “lat”: “40.07404”,
 “lon”: “-75.28487”,
 “nextstop”: “Conshohocken”,
 “source”: “Wilmington”,
 “dest”: “Norristown”
 }
While this API proved useful in development of the System Status dashboard, that’s a substantial amount of data to download, especially during rush hour and on a cellular connection. Surely we can do better.
I know! Let’s calculate our total and average train lateness info on the server side and just send back the results! That gives us this brand new API endpoint:
/api/current/system/latest/statsAnd this is what the output looks like:
“data”: {
 “num_trains”: 24,
 “total_min_late”: 57,
 “avg_min_late”: “2.4”,
 “num_trains_over_5_min_late”: 5,
 “num_trains_over_15_min_late”: 0,
 “num_trains_over_30_min_late”: 0,
 “timestamp”: “2016–04–04T23:33:22”
 }
Less than a K of data which can be used to convey state on the entire system. 🙂
This concludes the last of the dashboards that I wanted to introduce to the site. There are some more improvements and bugfixes in the works, the more significant ones of which will be blogged here.
Is there something you’d like to see? Drop by our GitHub issue tracker and see if it’s in the list, or create a new issue: https://github.com/dmuth/SeptaStats/issues
Now served with recycled electrons! http://www.SeptaStats.com/